EvoLiteracy News 02 22 2016
 If you are on Twitter (or Facebook), you have probably asked yourself two questions: Am I less popular than my social-media friends? Am I less happy than them? These phenomena (i.e. cyber popularity or cyber happiness) are both real and perceptual.

A paper, by Bollen et al. (total four coauthors), which is available as manuscript (The Happiness Paradox: Your Friends Are Happier Than You), caught my attention. The authors provide evidence of complex associations between the “friendship paradox” and the “happiness paradox.” Enjoy. – Guillermo Paz-y-Miño-C
What is the Friendship Paradox? The perception that YOU are less popular than your friends (on average).
What is the Happiness Paradox? The perception that YOU are less happy than your friends (on average).
What is the issue (so what)? The friendship paradox has been documented in the scientific literature (see Suggested Readings below), but the happiness paradox has remained untested, without quantitative demonstration that it actually happens. Or that, if it does, it occurs in association –somehow– with the friendship paradox. The paper by Bollen et al. makes such connection.
To make it easier for our readers, I will summarize the Bollen et al. study in a digestible manner, although the authors themselves do a fine job explaining the theory, the data and the implications of the research to a specialized audience (see PDF of manuscript). But, for the non-scientists, my summary below might help.
The observations in nature (the social environment):
Online social networking is associated with elevated levels of loneliness, anxiety, displeasure, and dissatisfaction. For example, many times you are on Twitter (or Facebook, or alike social media), you experience an overall sensation that your average contacts (i.e. friends, people you follow, or your followers) have more friends or followers than you do, or are happier than you are.
When measured in number of friends-connections, most people tend to have fewer friends than their own friends do on average. Why? Watch the short video posted below (1 minute 36 seconds of your time) for a friendly introduction to the Friendship Paradox.
Now, let us examine numerically how the Friendship Paradox emerges from a simple example. Imagine a social network of four people, as depicted in the image below: Ana has 1 friend (Bill). Bill has 3 friends (Ana, Carla and Dan). Carla and Dan have 2 friends each (Bill, and each other).

There are 8 friends in the network (1 + 3 + 2 + 2). Thus, on average, each person has 2 friends (8/4 = 2).
However, how many friends does each person’s friends have (i.e. how many friends of friends)? Ana is connected to +3 friends of friends, via Bill (who has 3 friends), a subtotal of 3 friends of friends. Bill is connect to 1 + 2 + 2 friends of friends (Ana has 1, Carla has 2, and Dan has 2), a sub total of 5 friends of friends. Carla is connected to 3 + 2 friends of friends (Bill has 3 and Dan has 2), a sub total of 5 friends of friends. And Dan is connected to 3 + 2 friends of friends (Bill has 3 and Carla has 2), a sub total of 5 friends of friends. Therefore, the grand total of friends of friends in the network is 18.
What is the average number of friends of friends? We obtain this number by dividing the total number of friends of friends in the network (=18) by the total number of friends in the network (=8), which gives us a value of 2.25. The Friendship Paradox becomes evident for Ana, Carla and Dan since their average number of friends in the network (=2.0) is lower than the average number of friends of friends in the network (=2.25). The phenomenon is particularly acute for Ana since she has a single friend (Bill) and, therefore, her friendship relations are clearly below both the average number of friends in the network (2.0) and the average number of friends of friends in the network (2.25).
This overall sampling bias effect (= the Friendship Paradox) results –in part– from Bill’s presence in the network. Bill has the most friends and is more often counted in the friends of friends tabulation, thus rising the average value (to 2.25).
The hypothesis
At least in part, Bollen et al. tested the hypothesis that the friendship and happiness paradoxes are predictable byproducts (effects) of universal social network connectivity patterns. And that associations between friendship and happiness also derived from such connectivity (note that the Friendship Paradox has been demonstrated numerous times, but Bollen et al. demonstrated it again with their sample to be able to link it to the Happiness Paradox, the central aspect of their paper).
The phenomena “friendship paradox” or “happiness paradox” result from the inherent structural bias in social networks that favor popular individuals (like Bill, above), who are, by definition, more likely to belong to someone’s social circle. For example, when individuals like you and I equate popularity of our cyber-friends with their cyber-prestige, and compare our own popularity to theirs, we tend to increase our levels of dissatisfaction with ourselves (i.e. we tend to enhance, in our minds, the effects of the friendship-paradox- or the happiness-paradox).
The predictions
Bollen et al. predicted that the effects of the friendship paradox will extend beyond popularity. If popular individuals tend to be happier, then their elevated happiness will become more prevalent as well. Thus, friendship-levels and happiness-levels (as per both paradoxes) should correlate, and this relationship should be measurable.
The authors also predicted that unhappiness will contribute more directly to the negative psycho-social effects of social networking, since it will affect how individuals assess their own subjective wellbeing (i.e. general happiness/unhappiness or life satisfaction/dissatisfaction relative to that of others).
The friendship paradox or the happiness paradox will generate predictable distributions of data, as shown in Fig. 1, below:

Figure 1. Predictable distributions of data expected if the Friendship or Happiness paradoxes are supported by the data (redrawn and adapted from Bollen et al.).
The study
Bollen et al. examined 40,000 Twitter users connected by reciprocal friendship (i.e. people that follow each other).
Two distinctive groups were characterized, the Unhappy group and the Happy group, by applying a subjective assessment of their wellbeing (derived from the Twitter-users’ interactions with their cyber-neighbors), which ranged in a scale from -1.0 (unhappy) to +1.0 (happy).
As shown in Fig. 2, below, both the Unhappy and Happy groups experienced evident friendship-paradox effects (i.e. members of both groups did have, or thought that their friends had, more friends, on average, than themselves). Interestingly, the intensity of the friendship paradox was weaker in the Unhappy group (left) than in the Happy group (right).

Figure 2. Friendship-paradox effects on the Unhappy (left) and Happy (right) groups. Note how the intensity of the friendship paradox was weaker in the Unhappy group than in the Happy group. The “clouds” of data correspond to point distributions of each of the 40,000 Twitter users in the study (modified from Bollen et al.).
In addition, as Fig. 3, below, suggests, both the Happy (top) and Unhappy (bottom) groups experienced clear happy-paradox effects. However, the intensity of the happiness paradox was stronger in the Unhappy group (see the very steep slope in the data point distribution, plus the amount of data points over the main line) than in the Happy group (see the not-so-steep slope in the data point distribution, plus the amount of data points over the main line). In essence, the majority of the sampled Twitter users were less happy (or more unhappy) than their friends on average. These findings support the idea that the Happiness Paradox is real.

Figure 3. Scatter point distributions of an individual’s (exemplified by YOU) sense of happiness as function of his/her (exemplified by YOUR) friends’ average sense of happiness (modified from Bollen et al.).
Individual Happiness and average friends’ Happiness were more strongly related within the Unhappy group than within the Happy group (Fig. 3). Bollen et al. refer to the clustering of unhappy users with themselves, and happy users also with themselves, as being homophilic or assortative in their social networking (both are common terms in behavioral sciences).
Figure 4, below, corroborates the finding that Unhappy Twitter users had fewer friends, on average, than the Happy Twitter users had, on average.

Figure 4. Unhappy Twitter users had fewer friends, on average, than the Happy Twitter users had, on average (modified from Bollen et al.).
Figure 5, below, corroborates the finding that the Happiness Paradox affected more the Unhappy Twitter users, on average, than the Happy Twitter users, on average.

Figure 5. The Happiness Paradox affected more the Unhappy Twitter users, on average, than the Happy Twitter users, on average (modified from Bollen et al.).
Paradoxically, however, as shown in Fig. 6, below, there was a weak correlation between individual happiness and individual popularity for the Unhappy group (Pearson’s R = -0.047; range -0.08 to -0.013). For the Happy group, the correlation was more pronounced (Pearson’s R = 0.126; range 0.081 to 0.171).
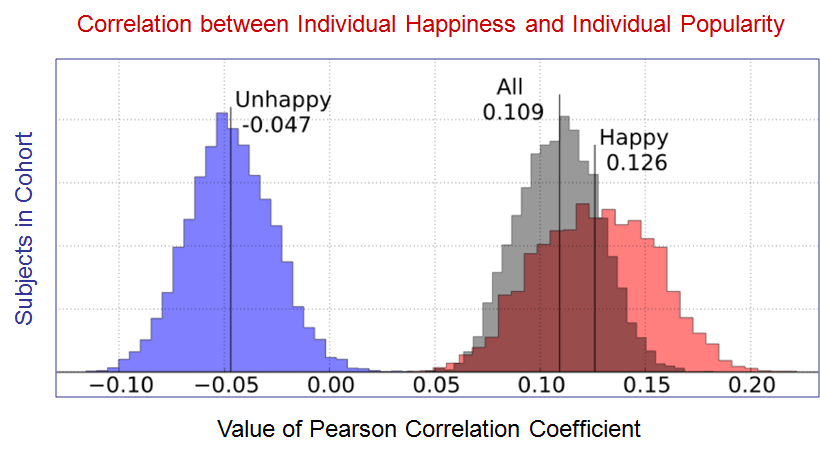
Figure 6. There was a weak correlation between individual happiness and individual popularity for the Unhappy group. For the Happy group, the correlation was more pronounced (modified from Bollen et al.).
The overall results suggest that unhappy Twitter users were more strongly affected by the lower happiness of their friends, possibly explaining why this group exhibited a stronger Happiness Paradox (Figs. 3 and 5) in the absence of a strong correlation between Happiness and Popularity (Fig. 6).
Warnings
Bollen et al. warn us that:
Observations of decreased happiness among social media users may result directly from a widespread inflated perception of the happiness of one’s friends.
Given the large role that social media (e.g. Twitter, Facebook) plays in the social lives of billions of individuals, the authors suggest that these environments may induce long-term changes in the public’s social behavior and may, over time, alter the very nature of social relations themselves. — EvoLiteracy.

You must be logged in to post a comment.