Today, my picks for EvoLiteracy News include: First, the 2014-2015 report on best college-cities released by the American Institute for Economic Research; different from other assessments, which are often student-satisfaction oriented, the AIER report concentrates on more serious metrics. Second, a review of the placement of sponges and comb jellies in phylogenetic reconstructions of all animals, with new ideas on how to improve our understanding of the evolution of “animal complexity.” Third, an overview of biodiversity extinction rates worldwide, which suggests a fast speed of species decline associated with climate change. The video treat of the day comes from TEDEd and is about “Biodiversity” (ecosystems, species, genetics). Enjoy! — GPC.
Top College Cities in the US, AIER 2014-2015 Report.

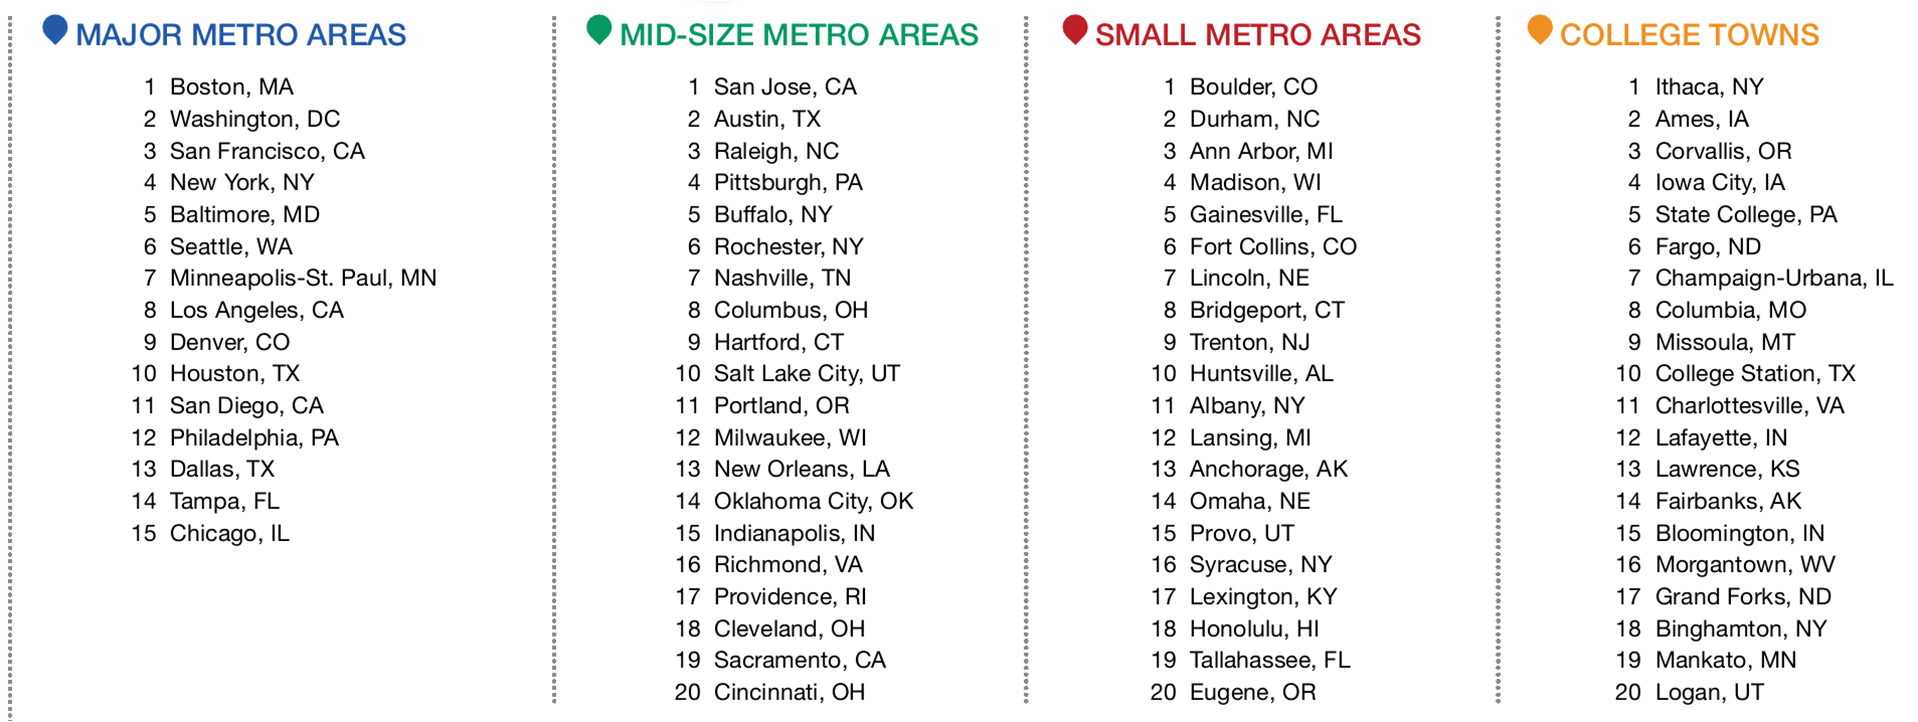
The AIER College Destinations Index (click on image to enlarge)
The American Institute for Economic Research (AIER) has released its 2014-2015 College Destination Index, which ranks 75 college-/ university-cities (large, medium-/ small-size metropolitan areas, and small towns) in the United States, according to 4 categories and 12 criteria. The Top 15 Major Metropolitan Areas include Boston MA, Washington DC, San Francisco CA, New York NY and Baltimore MD (plus ten others). The Top 20 Mid-Size Metropolitan Areas: San Jose CA, Austin TX, Raleigh NC, Pittsburgh PA and Buffalo NY (plus fifteen others). The Top 20 Small Metropolitan Areas: Boulder CO, Durham NC, Ann Harbor MI, Madison WI and Gainesville FL (plus fifteen others). And the Top 20 College Towns: Ithaca NY, Ames IA, Corvallis OR, Iowa City IA and State College PA (plus fifteen others).
The categories and “per-category-within criteria” used to rank the cities and towns can be summarized as follows:
1st category Student Life, which includes the following criteria: student concentration, cost of housing, and city accessibility.
2nd category Economic Health, which includes: arts and leisure, international students, and innovation producers.
3rd category Culture: employment rate, entrepreneurial activity, and brain drain or gain.
4th category Opportunity: research and development per student, college educated, and earning potential.
The city list follows (click on image to enlarge). Major metropolitan areas (greater than 2.5 million residents), mid-size metro areas (1.0 to 2.5 million residents), small metro areas (250,000 to 1.0 million residents), and towns (under 250,000 residents):
Click on image to enlarge
The complete report is available at AIER.
The hidden biology of sponges and ctenophores (comb jellies), published in Trends in Ecology and Evolution.

Left, Calcareous Sponge (Everglades University). Right, Leidy’s Comb Jelly (National Aquarium)
This is a particularly important review by Casey Dunn, Sally Leys and Stephen Haddock, and here is why, as the authors state it “viewing all animals through a bilaterian lens distorts the view of animal evolution.” The authors explain: “For more than a century, early animal evolution has been presented as a ladder, where ‘primitive’ living species are thought of as the ancestors of ‘complex’ living species… [T]his ladder-like perspective has led to considerable confusion, such as the frequent description of some living animals as ‘basal’, ‘living fossils’, or ancestors of other living animals, even though they are just as far from the base of the tree as other animals are…We cannot array animals from simple to complex, because there is no single axis of complexity. Organisms have a mix of simple and complex traits, but many are currently hidden to us…”
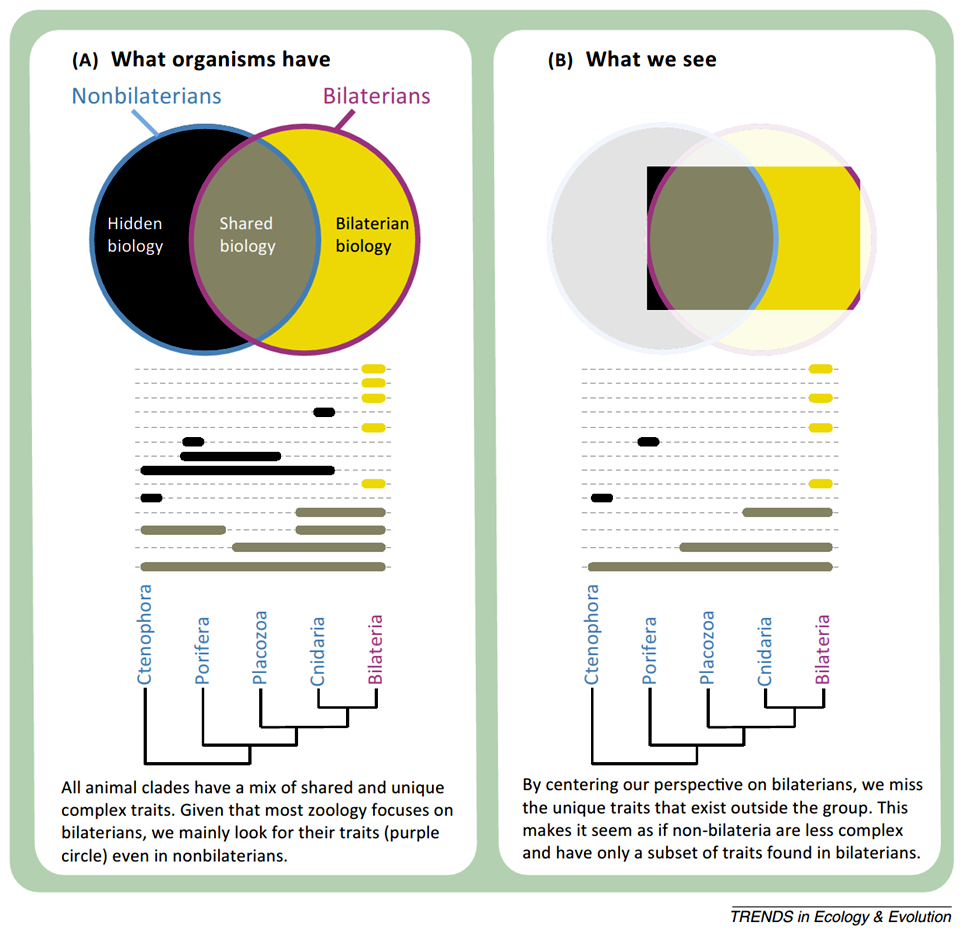
Dunn et al. state: “Strong ascertainment bias means that there are many aspects of nonbilaterian biology that we are not equipped to see: we call this ‘hidden biology’. This unseen hidden biology leads to a discrepancy between the traits organisms have (A) and the traits we see (B). One consequence is the underestimation of the complexity and diversity of nonbilaterian animals.”
Highlights from the journal include: “Animal evolution is often presented as a march toward complexity, with different living animal groups each representing grades of organization that arose through the progressive acquisition of complex traits. There are now many reasons to reject this classical hypothesis. Not only is it incompatible with recent phylogenetic analyses, but it is also an artifact of ‘hidden biology’, that is, blind spots to complex traits in non-model species. A new hypothesis of animal evolution, where many complex traits have been repeatedly gained and lost, is emerging. As [Dunn et al.] discuss [in the article], key details of this new model hinge on a better understanding of the Porifera and Ctenophora, which have each been hypothesized to be sister to all other animals, but are poorly studied and often misrepresented.”
The significance of the review is presented, by TREE, as follows:
- Ctenophores or sponges are the sister group to all other animals.
- Biases hide some complex traits in these animals and make them appear simpler than they are.
- These biases supported the misconception that living animals represent grades of complexity.
- It is critical to investigate the unique but hidden biology of ctenophores and sponges.

Hypotheses proposed for the phylogenetic relations between sponges, ctenophores, and other animals. (A) Porifera is the sister group to all other animals. Ctenophora and Cnidaria are sister groups, forming Coelenterata. (B) Porifera is the sister group to all other animals. Ctenophora and Bilateria are sister groups, forming Acrosomata, a relation recovered in some morphological analyses but no molecular analyses. (C) Ctenophora is the sister group to all other animals. Some analyses that recover this result also place Placozoa, Bilateria, and Cnidaria in a clade that has been called ‘Parahoxozoa’ (click on image to be redirected to TREE).
The complete study is available at TREE.
Accelerating extinction risk from climate change. South America, Australia and New Zealand at highest risk. Science Magazine.
Mark C. Urban has prepared a special report for Science, on species extinction rates associated with climate change, which he summarizes as follows: “Current predictions of extinction risks from climate change vary widely depending on the specific assumptions and geographic and taxonomic focus of each study. [The author] synthesized published studies in order to estimate a global mean extinction rate and determine which factors contribute the greatest uncertainty to climate change–induced extinction risks. Results suggest that extinction risks will accelerate with future global temperatures, threatening up to one in six species under current policies. Extinction risks were highest in South America, Australia, and New Zealand, and risks did not vary by taxonomic group. Realistic assumptions about extinction debt and dispersal capacity substantially increased extinction risks. We urgently need to adopt strategies that limit further climate change if we are to avoid an acceleration of global extinctions.”
According to the report, the predicted species extinction risks from climate change differed by region: “…the highest risks characterized South America, Australia, and New Zealand (14 to 23%), and the lowest risks characterized North America and Europe (5 to 6%).” The map below depicts, in color, the regional relative risk:

Predicted extinction risks from climate change (click on image to go to source)
The complete report is available, in full, at Science Magazine.
Video:
The video-treat of the day comes from TEDEd “Why Is Biodiversity So Important?” The narrative about this clip explains: “Our planet’s diverse, thriving ecosystems may seem like permanent fixtures, but they’re actually vulnerable to collapse. Jungles can become deserts, and reefs can become lifeless rocks. What makes one ecosystem strong and another weak in the face of change? Kim Preshoff details why the answer, to a large extent, is biodiversity.”

You must be logged in to post a comment.