Each of three parallel workshop sessions was attended by about 20 people. I enjoyed our session (The Values of Science) very much, perhaps precisely due to the size of the meeting, the diversity of scholars participating (i.e. sociologists, chemists, anthropologists, philosophers, physicists, biologists, educators, media specialists), and the interdisciplinary format of the discussions.
The entire program is available here. Our workshop session included:
The Values of Science
Anti-scientism and Its Impact on the Relationship between Science and Religion: The Role of Science in a Postmodern Society. Dr. Mohamed Almisbkawy, Department of Philosophy, British University in Egypt, Fayoum University, Cairo, Egypt. Overview: The clash between classic science and religion was due to the similarly in their internal structures. Science has overcome this nature of scientific system by shifting from scientism to anti-scientism.
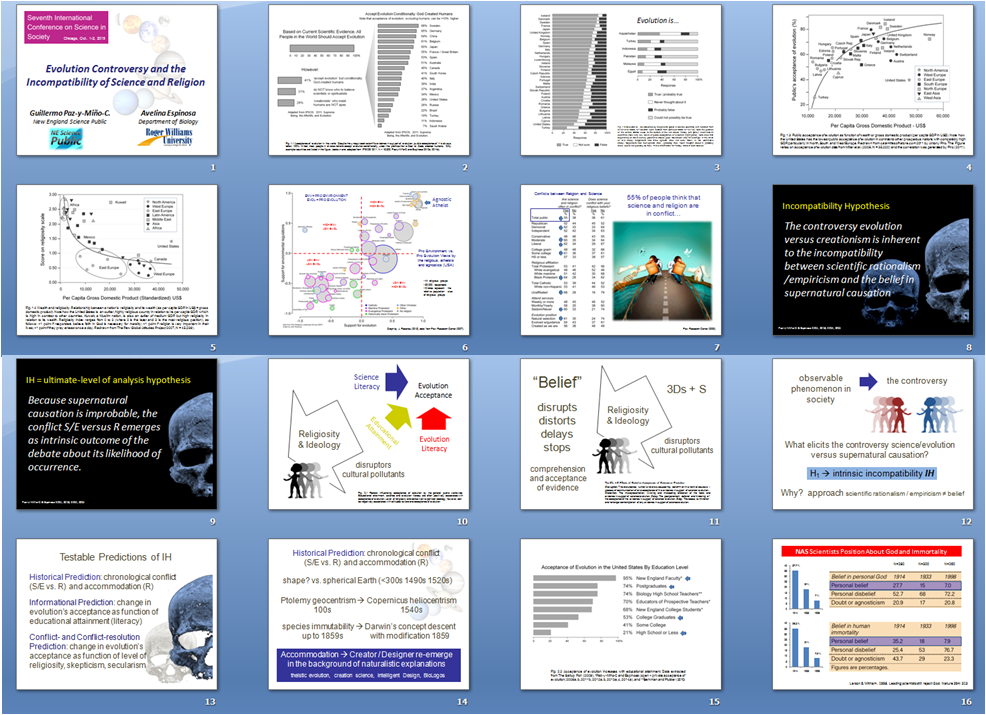
Evolution Controversy: A Phenomenon Prompted by the Incompatibility between Science and Religious Beliefs. Dr. Guillermo Paz-y-Miño-C, New England Center for the Public Understanding of Science and New England Science Public, Roger Williams University, Bristol, USA. Dr. Avelina Espinosa, New England Center for the Public Understanding of Science and New England Science Public, Roger Williams University, Bristol, USA. Overview: This paper explores the evolution controversy under three predictions of the incompatibility hypothesis.
Some of the images used in our presentation at the VII International Conference on Science in Society, Chicago, October 1-2, 2015. We discussed in detail the Incompatibility Hypothesis.
Formally Trained Science Communicators: A Solution to the Unreasonable Expectations Placed on Lay People and Professional Scientists. Dr. Teresa Branch-Smith, Department of Philosophy, University of Waterloo, Waterloo, Canada. Jay Michaud, Department of Philosophy, University of Waterloo, Waterloo, Canada. Overview: We need to formally train science communicators to facilitate the transmission of knowledge from scientists to people because it requires expertise that neither group should be expected to acquire independently.
Our hostesses and organizers of the VII International Conference on Science in Society at The University Center Chicago, October 1-2, 2015.
The complete article, which includes 23-pages, 11 figures and 59 references, can be downloaded —for free— from the International Journal of Science in Society. Click on the image (left) to go to the journal website to download the PDF.
Protisto-Biologists Flock to Seville for ECOP-ISOP Scientific Meeting
Joan Strassmann (left) and Avelina Espinosa (right) discussing kin-recognition in unicellular eukaryotes (protists) at a symposium organized for the purpose at the ECOP-ISOP 2015 conference in Seville, Spain.
SEVILLE, SPAIN (EvoLiteracy Sep. 9, 2015) — Organized by ECOP-ISOP, the protistologists’ meetings always surprise me, not only because I must pinch others to remind them that unicellular eukaryotes, or “protists,” are the stars of these annual conferences, but also because like no other scientific gathering, these events attract world specialists who share passion for organisms that look –and are– single celled. That’s it; all distantly –and some more closely– related groups of “unicell” creatures that populate the Earth, and in all environments. The evolutionary concestors of animals, plants and fungi.
I have attended these meetings during the past five years: Kent, UK 2010; Berlin, Germany 2011; Oslo, Norway 2012; and Banff, Canada 2014. I missed the 2013 reunion in Vancouver, Canada, which I had no alternative but to trade it for the World Evolution Summit in the Galapagos.
Plenary session on Cryptic Diversity in Organisms and Organelles, ECOP-ISOP 2015 meeting in Seville, Spain.
The ECOP-ISOP (European Congress of Protistology – International Society of Protistologists) meetings will run September 5-10, 2015, and the sessions will take place at the Reina Mercedes Scientific Campus of the University of Seville. The format will include plenary lectures, symposia, workshops, and posters (mostly by graduate students).
The Reina Mercedes Scientific Campus of the University of Seville where the ECOP-ISOP 2015 meeting will take place from September 5th to 10th.
Top: Phylogeny and Evolution presentations just ended, today, September 9th. Bottom: Poster session discussions, a friendly setting for one-on-one (or two) interactions.
The complete article, which includes 23-pages, 11 figures and 59 references, can be downloaded —for free— from the International Journal of Science in Society. Click on the image (left) to go to the journal website to download the PDF.
“The sweet spot of this collection of essays is the interface of science, history and literacy. Paz-y-Miño-C is, in essence, a champion of rationalism and a passionate defender of literacy standards. His essays deftly weave hard survey data and memorable turns of phrase with evocative imagery… While the essays in this collection are vast in coverage —from climate change to energy policy, stem cell research, vaccinations and, especially, evolution— a clear underlying theme emerges: [the author’s] goal is no less than to counter, through the lens of history and the majesty of rationalism, social forces that sanction ignorance, celebrate denial and… continue to diminish our global status in the fields of science and technology.” Jeff Podos, PhD, Professor of Biology, University of Massachusetts Amherst, USA.
“Paz-y-Miño-C is a firm believer in evolutionary processes. He would like to see decisions made on the basis of facts, not unsupported opinion. He abhors and fears irrational thinking, especially ‘the views of those who see evil in truth and menace in the realities discovered by science.’ He marvels at the intricacy and diversity of life, and how it came about through natural selection… and is clearly frustrated by the unwillingness of so many to see the beauty and majesty in this view of the world and all that it explains.” – Jan A. Pechenik, PhD, Professor of Biology, Tufts University, USA, author of The Readable Darwin: The Origin of Species, as Edited for Modern Readers.
Happy Friday everyone! Today’s EvoLiteracy News include: First, a behavioral study suggesting that blue whales might lack the innate behavioral repertoire to avoid collisions with cargo ships; after all, ships are relatively new, strange objects in the oceans, in contrast to the millions-of-years of whale evolutionary history in pristine environments. Second, a very important analysis on why scientist should avoid using bar-graphs to report data and, instead, go for more compelling alternatives for data depiction in scientific journals. And third, a super simple, yet powerful video on how to interpret population pyramids. Enjoy! — GPC.
Blue whales have limited behavioral responses for avoiding collision with large ships. Published in Endangered Species Research.
Why do blue whales not avoid collisions with cargo ships by simply swimming away or deep diving when danger approaches? It seems like the whales lack the behavioral repertoire to interpret the ships as danger; after all, cargo ships are new, foreign items in the whales’ natural environment; whales have evolved for millions of years without unnatural disturbances in the oceans. A new study by McKenna et al. (total five coauthors) brings some light into this problem, but clear-cut, definite answers are still needed.
McKenna et al. summarize the research as follows: “Collisions between ships and whales are reported throughout the world’s oceans. For some endangered whale populations, ship strikes are a major threat to survival and recovery. Factors known to affect the incidence and severity of collisions include spatial co-occurrence of ships and whales, hydrodynamic forces around ships, and ship speed. Less understood and likely key to understanding differences in interactions between whales and ships is whale behavior in the presence of ships. In commercial shipping lanes off southern California, [the authors] simultaneously recorded blue whale behavior and commercial ship movement. A total of 20 ship passages with 9 individual whales were observed at distances ranging from 60 to 3600 m. [The researchers] documented a dive response (i.e. shallow dive during surface period) of blue whales in the path of oncoming ships in 55% of the ship passages, but found no evidence for lateral avoidance. Descent rate, duration, and maximum depth of the observed response dives were similar to whale behavior immediately after suction-cup tag deployments. These behavioral data were combined with ship hydrodynamic forces to evaluate the maximum ship speed that would allow a whale time to avoid an oncoming ship. [The authors’] analysis suggests that the ability of blue whales to avoid ships is limited to relatively slow descents, with no horizontal movements away from a ship. [The authors] posit that this constrained response repertoire would limit their ability to adjust their response behavior to different ship speeds. This is likely a factor in making blue whales, and perhaps other large whales, more vulnerable to ship strikes.” Open access to PDF of paper is available at ESR.
Should scientific journals request authors to change their practices for presenting continuous data in small sample size studies? An article in PLoS Biology recommends it.
This article is particularly important, it provides all of us with urgent advice on how to report statistical analyses (i.e. graphics of small samples) in our papers. Weissgerber et al. (total five authors) strongly recommend journal editors, authors and the scientific community to be more cautious when presenting results to readers, and here is why:
I will simplify the complexity of the Weissgerber et al. paper (although it is very friendly written) by addressing only what is substantial and eliminating the technicalities. However, readers might need to explore the content below with quality attention.
Let’s start by summarizing the authors’ abstract: “Figures in scientific publications are critically important because they often show the data supporting key findings… [As] scientists, we urgently need to change our practices for presenting continuous data in small sample size studies. Papers rarely [include] scatterplots, box plots, and histograms that allow readers to critically evaluate continuous data. Most papers [present] continuous data in bar and line graphs. This is problematic, as many different data distributions can lead to the same bar or line graph. The full data may suggest different conclusions from the summary statistics. [The authors] recommend training investigators in data presentation, encouraging a more complete presentation of data, and changing journal editorial policies…”
Weissgerber et al. (PLoS Biology 2015) examined 700 studies published in reputable physiology journals. They “focused on physiology because physiologists perform a wide range of studies, including human studies, animal studies, and in vitro laboratory experiments.” The authors found that 86% of the studies reported statistical analyses in bar graphs, which can be misleading, particularly when small samples are being measured. They explain this in three main figures. Below, I summarize the Weissgerber et al.’s images and text, plus include explanations in color to facilitate the interpretation of the material (remember that the original article can be downloaded from PLoS Biology).
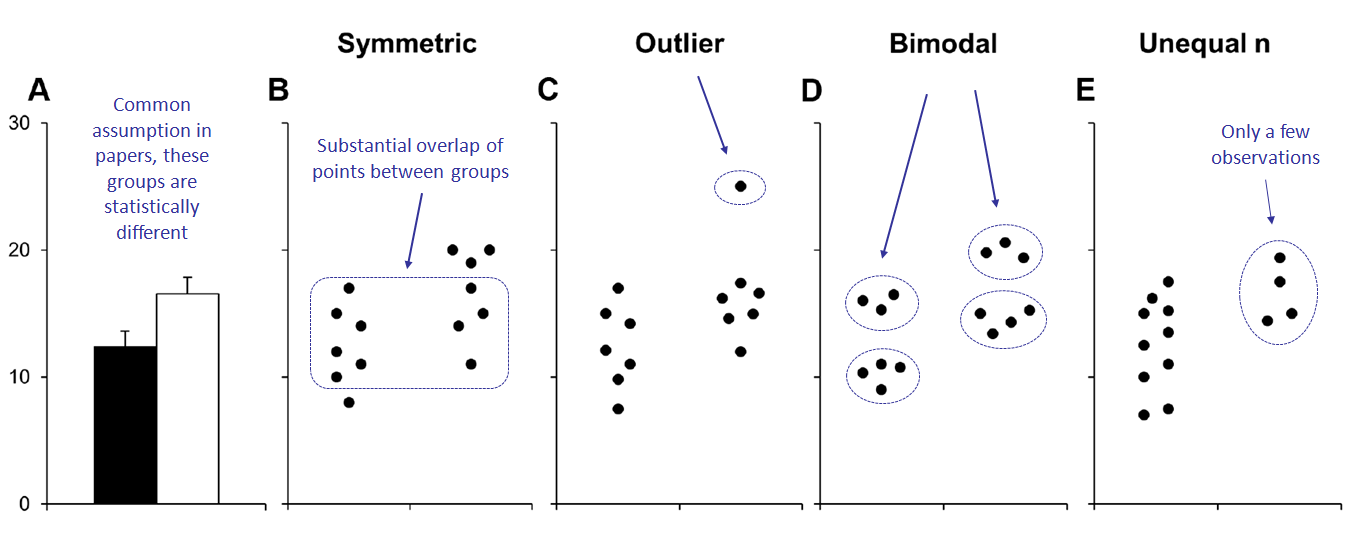
First: fundamentally different data sets could lead authors to report the results [and statistics] in bar graphs and draw from them unwarranted conclusions.
Adapted from Weissgerber et al. (PLoS Biology 2015). Click on image to enlarge.
Many different datasets can lead to the same bar graph, as depicted in the example of Panel A (above), a common practice in 86% of the scientific papers examined by Weissgerber et al. (PLoS Biology 2015). For instance, Panel A depicts two seemingly different groups, the black bar on the left is lower than the white bar on the right. Is this difference true and for the reasons we think?
The visualization of the full data (as depicted in Panels B, C, D and E) may suggest different conclusions as cautioned by Weissgerber et al. (PLoS Biology 2015).
Panel B: look how the data-point distributions in both groups appear symmetric. Although the data suggest a small difference between these groups, there is substantial overlap between groups (the position of many of the dots on the left clearly overlaps with the position of the dots on the right).
Panel C, the apparent difference between groups is driven by a single outlier.
Panel D suggests a possible bimodal distribution of the data points. Additional data are needed to confirm that the distribution is indeed bimodal and to determine whether this effect is explained by a covariate.
Panel E, the smaller range of values in group two (right) may simply be due to the fact that there are only a few observations (four data points). Additional data for group two would be needed to determine whether the groups are actually different.
Second: A common assumption in bar graphs is that the reported groups are not only different, but also independent. And that might not always be the case.
Adapted from Weissgerber et al. (PLoS Biology 2015). Click on image to enlarge.
Additional problems can emerge when using bar graphs to show paired data, as explained by Weissgerber et al. (PLoS Biology 2015):
The bar graph on Panel A (mean ± SE, where SE is Standard Error) suggests that the groups (black and white) are independent and provides no information about whether changes are consistent across individuals.
The scatterplots shown in the Panels B, C and D demonstrate that the data are paired, associated and not independent, as follows:
Panel B, data point values for every subject on the left group are higher on the right group (a one to one correspondence, they are closely associated).
Panel C, there are NO consistent differences between the two conditions (i.e. the data points, or “subjects,” on the left group behave erratically in respect to their counterparts on the right group: some lines go up, others go down, others are roughly horizontal, which indicates no clear pattern, nor close association between the groups).
Panel D suggests that there may be distinct subgroups of “responders” and “nonresponders.”
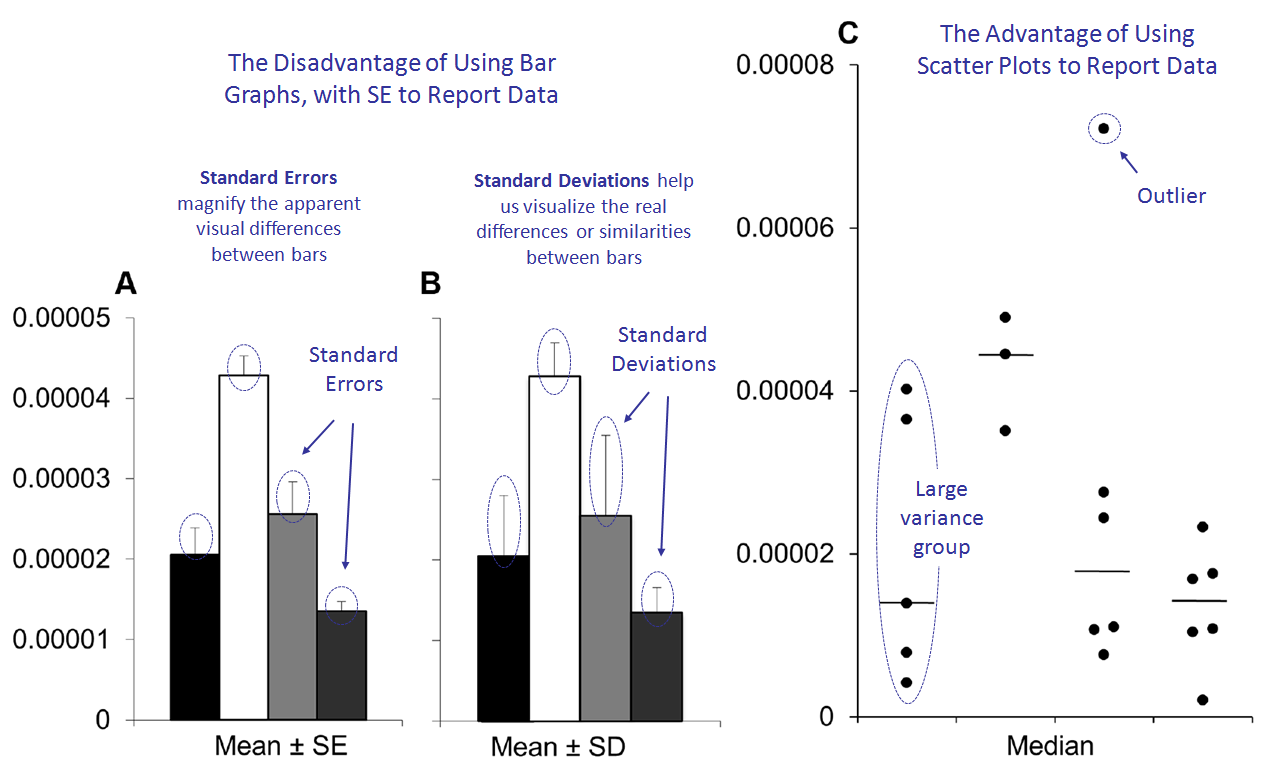
Third: Scatter plots are better alternatives to reporting data than bar graphs, particularly of small samples. And, using Standard Deviation lines, instead of Standard Errors, might be more informative to readers.
Adapted from Weissgerber et al. (PLoS Biology 2015). Click on image to enlarge.
Bar graphs and scatter plots convey very different information, as Weissgerber et al. (PLoS Biology 2015) explain:
Bar graphs discourage the reader from critically evaluating the statistical tests conducted in the analyses and the authors’ own interpretation of the data.
Panel A presents data in bar graphs showing mean values (the height of the bars) ± SE (Standard Errors, or the “T” shaped lines on top of the bars). Panel A suggests that the second group (white bar) has higher values than the remaining groups. But this might not be necessarily true because the Standard Errors measure only “the accuracy of the mean.” However, see what happens in Panel B (below).
Panel B presents data in bar graphs showing mean values ± SD (Standard Deviations, or the “longer T shaped lines” [in respect to those of Panel A] on top of the bars). Note that Panel B reveals that there is considerable overlap between groups (i.e. the horizontal projections of the “T” shaped lines overlap with one another). This is because Standard Deviations measure “the variation in the samples,” rather than the accuracy of the mean as in the case of the Standard Errors.
Thus, showing SE (Panel A) rather than SD (Panel B) magnifies the apparent visual differences between groups, and this is exacerbated by the fact that SE obscures any effect of unequal sample size.
Yet, Weissgerber et al. (PLoS Biology 2015) indicate that the scatter plot (Panel C) –a better alternative to A or B– clearly shows that the sample sizes are small in all groups, plus group one has a much larger variance than the other groups, and there is an outlier in group three. These problems are not apparent in the bar graphs shown in Panels A or B.
The complete article, supplementary materials, and companion Excel file to assist readers conduct similar analyses can be downloaded from PLoS Biology.
Video:
My video/animation of the day comes, again, from TED-Ed Originals on “Population Pyramids: Powerful Predictors of the Future.” I use this animation to explain to students the relevance of understanding basic data on population demography. The producers explain: “Population statistics… can help predict a country’s [demographic] future (and give important clues about the past). [A] population pyramid [can help] policymakers and social scientists make sense of [demographic] statistics by, [as discussed in the animation, analyzing different types of pyramids].”
Today, my picks for EvoLiteracy News include: First, the 2014-2015 report on best college-cities released by the American Institute for Economic Research; different from other assessments, which are often student-satisfaction oriented, the AIER report concentrates on more serious metrics. Second, a review of the placement of sponges and comb jellies in phylogenetic reconstructions of all animals, with new ideas on how to improve our understanding of the evolution of “animal complexity.” Third, an overview of biodiversity extinction rates worldwide, which suggests a fast speed of species decline associated with climate change. The video treat of the day comes from TEDEd and is about “Biodiversity” (ecosystems, species, genetics). Enjoy! — GPC.
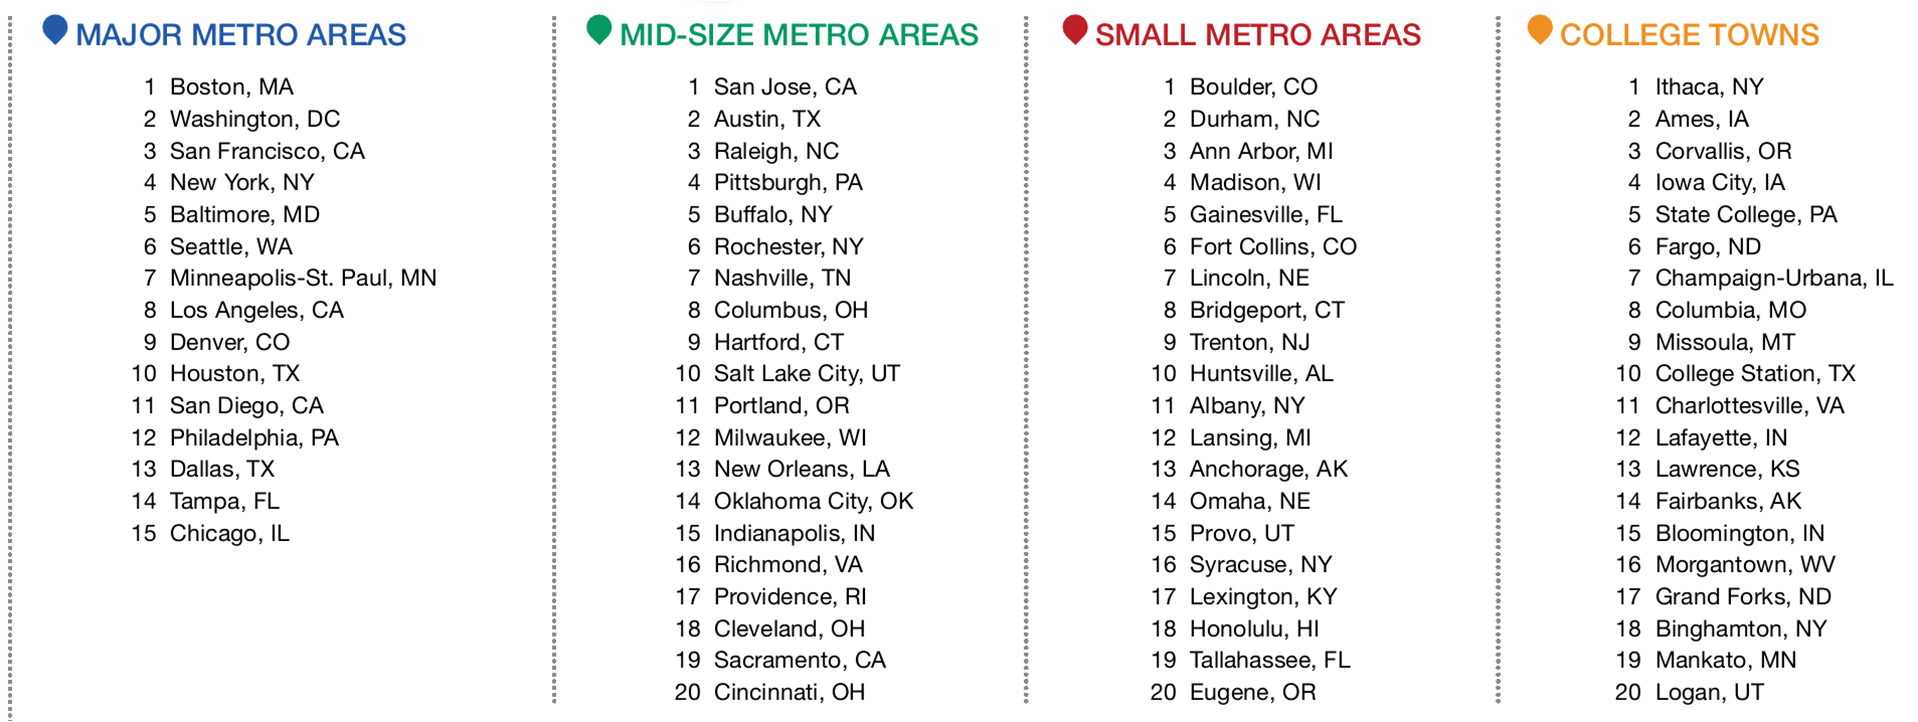
The AIER College Destinations Index (click on image to enlarge)
The American Institute for Economic Research (AIER) has released its 2014-2015 College Destination Index, which ranks 75 college-/ university-cities (large, medium-/ small-size metropolitan areas, and small towns) in the United States, according to 4 categories and 12 criteria. The Top 15 Major Metropolitan Areas include Boston MA, Washington DC, San Francisco CA, New York NY and Baltimore MD (plus ten others). The Top 20 Mid-Size Metropolitan Areas: San Jose CA, Austin TX, Raleigh NC, Pittsburgh PA and Buffalo NY (plus fifteen others). The Top 20 Small Metropolitan Areas: Boulder CO, Durham NC, Ann Harbor MI, Madison WI and Gainesville FL (plus fifteen others). And the Top 20 College Towns: Ithaca NY, Ames IA, Corvallis OR, Iowa City IA and State College PA (plus fifteen others).
The categories and “per-category-within criteria” used to rank the cities and towns can be summarized as follows:
1st category Student Life, which includes the following criteria: student concentration, cost of housing, and city accessibility.
2nd category Economic Health, which includes: arts and leisure, international students, and innovation producers.
3rd category Culture: employment rate, entrepreneurial activity, and brain drain or gain.
4th category Opportunity: research and development per student, college educated, and earning potential.
The city list follows (click on image to enlarge). Major metropolitan areas (greater than 2.5 million residents), mid-size metro areas (1.0 to 2.5 million residents), small metro areas (250,000 to 1.0 million residents), and towns (under 250,000 residents):
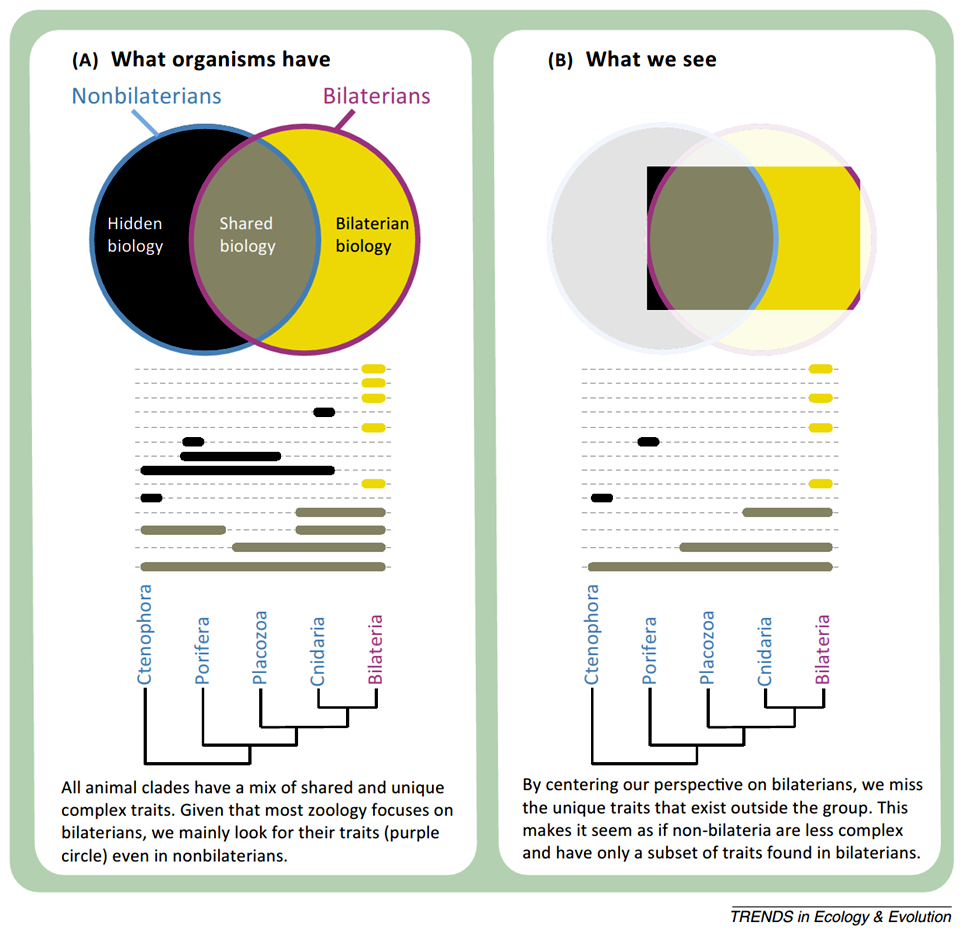
This is a particularly important review by Casey Dunn, Sally Leys and Stephen Haddock, and here is why, as the authors state it “viewing all animals through a bilaterian lens distorts the view of animal evolution.” The authors explain: “For more than a century, early animal evolution has been presented as a ladder, where ‘primitive’ living species are thought of as the ancestors of ‘complex’ living species… [T]his ladder-like perspective has led to considerable confusion, such as the frequent description of some living animals as ‘basal’, ‘living fossils’, or ancestors of other living animals, even though they are just as far from the base of the tree as other animals are…We cannot array animals from simple to complex, because there is no single axis of complexity. Organisms have a mix of simple and complex traits, but many are currently hidden to us…”
Dunn et al. state: “Strong ascertainment bias means that there are many aspects of nonbilaterian biology that we are not equipped to see: we call this ‘hidden biology’. This unseen hidden biology leads to a discrepancy between the traits organisms have (A) and the traits we see (B). One consequence is the underestimation of the complexity and diversity of nonbilaterian animals.”
Highlights from the journal include: “Animal evolution is often presented as a march toward complexity, with different living animal groups each representing grades of organization that arose through the progressive acquisition of complex traits. There are now many reasons to reject this classical hypothesis. Not only is it incompatible with recent phylogenetic analyses, but it is also an artifact of ‘hidden biology’, that is, blind spots to complex traits in non-model species. A new hypothesis of animal evolution, where many complex traits have been repeatedly gained and lost, is emerging. As [Dunn et al.] discuss [in the article], key details of this new model hinge on a better understanding of the Porifera and Ctenophora, which have each been hypothesized to be sister to all other animals, but are poorly studied and often misrepresented.”
The significance of the review is presented, by TREE, as follows:
Ctenophores or sponges are the sister group to all other animals.
Biases hide some complex traits in these animals and make them appear simpler than they are.
These biases supported the misconception that living animals represent grades of complexity.
It is critical to investigate the unique but hidden biology of ctenophores and sponges.
Hypotheses proposed for the phylogenetic relations between sponges, ctenophores, and other animals. (A) Porifera is the sister group to all other animals. Ctenophora and Cnidaria are sister groups, forming Coelenterata. (B) Porifera is the sister group to all other animals. Ctenophora and Bilateria are sister groups, forming Acrosomata, a relation recovered in some morphological analyses but no molecular analyses. (C) Ctenophora is the sister group to all other animals. Some analyses that recover this result also place Placozoa, Bilateria, and Cnidaria in a clade that has been called ‘Parahoxozoa’ (click on image to be redirected to TREE).
Accelerating extinction risk from climate change. South America, Australia and New Zealand at highest risk. Science Magazine.
Mark C. Urban has prepared a special report for Science, on species extinction rates associated with climate change, which he summarizes as follows: “Current predictions of extinction risks from climate change vary widely depending on the specific assumptions and geographic and taxonomic focus of each study. [The author] synthesized published studies in order to estimate a global mean extinction rate and determine which factors contribute the greatest uncertainty to climate change–induced extinction risks. Results suggest that extinction risks will accelerate with future global temperatures, threatening up to one in six species under current policies. Extinction risks were highest in South America, Australia, and New Zealand, and risks did not vary by taxonomic group. Realistic assumptions about extinction debt and dispersal capacity substantially increased extinction risks. We urgently need to adopt strategies that limit further climate change if we are to avoid an acceleration of global extinctions.”
According to the report, the predicted species extinction risks from climate change differed by region: “…the highest risks characterized South America, Australia, and New Zealand (14 to 23%), and the lowest risks characterized North America and Europe (5 to 6%).” The map below depicts, in color, the regional relative risk:
Predicted extinction risks from climate change (click on image to go to source)
The video-treat of the day comes from TEDEd “Why Is Biodiversity So Important?” The narrative about this clip explains: “Our planet’s diverse, thriving ecosystems may seem like permanent fixtures, but they’re actually vulnerable to collapse. Jungles can become deserts, and reefs can become lifeless rocks. What makes one ecosystem strong and another weak in the face of change? Kim Preshoff details why the answer, to a large extent, is biodiversity.”
Today’s EvoLiteracy News include: First, the discovery of a vegetarian T. rex- phylogenetic relative from Chile. Second, “bird accent” [vocalization] variation as function of elevation, a study of mountain chickadees. And, third, an extensive map documentation of seismic risks in North America. The special treat includes a superb video reconstruction of Hubble’s cosmic images, with links to historical photos in celebration of the telescope’s 25th anniversary. Enjoy! — GPC.
Was T. rex cousin a vegetarian? Plant-eatingtheropodChilesaurusfromtheLate JurassicperiodofChile. Nature.
Chilesaurus diegosuarezi Illustration by Gabriel Lío – Nature Magazine
A phylogenetic relative of Tyrannosaurus rex, recently discovered in Chile, fed on plants about 140 million years ago, in the Late Jurassic. Novas et al. (total 10 coauthors) summarize their study as follows: “Theropod dinosaurs were the dominant predators in most Mesozoic era terrestrial ecosystems. Early theropod evolution is currently interpreted as the diversification of various carnivorous and cursorial taxa, whereas the acquisition of herbivorism, together with the secondary loss of cursorial adaptations, occurred much later among advanced coelurosaurian theropods. A new, bizarre herbivorous basal tetanuran from the Upper Jurassic of Chile challenges this conception. The new dinosaur was discovered at Aysen, a fossil locality in the Upper Jurassic Toqui Formation of southern Chile (General Carrera Lake). The site yielded abundant and exquisitely preserved three-dimensional skeletons of small archosaurs. Several articulated individuals of Chilesaurus at different ontogenetic stages have been collected, as well as less abundant basal crocodyliforms, and fragmentary remains of sauropod dinosaurs (diplodocids and titanosaurians).” For complete article go to Nature.
Mountain chickadees from different elevations sing different songs. Can “bird accents” change with elevation? Royal Society Open Science.
Authors Carrie L.Branch andVladimir V.Pravosudov summarize their research as follows: “Song in songbirds is widely thought to function in mate choice and male–male competition. Song is also phenotypically plastic and typically learned from local adults; therefore, it varies across geographical space and can serve as a cue for an individual’s location of origin, with females commonly preferring males from their respective location. Geographical variation in song dialect may reflect acoustic adaptation to different environments and/or serve as a signal of local adaptation. In montane environments, environmental differences can occur over an elevation gradient, favouring local adaptations across small spatial scales. [Branch andPravosudov] tested whether food caching mountain chickadees, known to exhibit elevation-related differences in food caching intensity, spatial memory and the hippocampus, also sing different dialects despite continuous distribution and close proximity. Male songs were collected from high and low elevations at two different mountains (separated by 35 km) to test whether song differs between elevations and/or between adjacent populations at each mountain. Song structure varied significantly between high and low elevation adjacent populations from the same mountain and between populations from different mountains at the same elevations, despite a continuous distribution across each mountain slope. These results suggest that elevation-related differences in song structure in chickadees might serve as a signal for local adaptation.” For complete research go to Royal Society Open Science.
2014 Update of the United States National Seismic Hazard Maps. Research just released by the US Geological Society.
2014 Update of the US National Seismic Hazard Maps – Click on USGS or map for access to complete report
Petersen et al. (total 17 coauthors) summarize their research as follows: “The national seismic hazard maps for the conterminous United States have been updated to account for new methods, models, and data that have been obtained since the 2008 maps were released (Petersen and others, 2008). The input models are improved from those implemented in 2008 by using new ground motion models that have incorporated about twice as many earthquake strong ground shaking data and by incorporating many additional scientific studies that indicate broader ranges of earthquake source and ground motion models. These time-independent maps are shown for 2-percent and 10-percent probability of exceedance in 50 years for peak horizontal ground acceleration as well as 5-hertz and 1-hertz spectral accelerations with 5-percent damping on a uniform firm rock site condition (760 meters per second shear wave velocity in the upper 30 m, VS30). In this report, the 2014 updated maps are compared with the 2008 version of the maps and indicate changes of plus or minus 20 percent over wide areas, with larger changes locally, caused by the modifications to the seismic source and ground motion inputs. ” For complete report and maps go to USGS.
Video:
Celebrating the Hubble Telescope 25th Anniversary with an amazing video released by NASA: “This visualization provides a three-dimensional perspective on Hubble’s 25th anniversary image of the nebula Gum 29 with the star cluster Westerlund 2 at its core. The flight traverses the foreground stars and approaches the lower left rim of the nebula Gum 29. Passing through the wispy darker clouds on the near side, the journey reveals bright gas illuminated by the intense radiation of the newly formed stars of cluster Westerlund 2. Within the nebula, several pillars of dark, dense gas are being shaped by the energetic light and strong stellar winds from the brilliant cluster of thousands of stars. Note that the visualization is intended to be a scientifically reasonable interpretation and that distances within the model are significantly compressed.”
Today, EvoLiteracy News picks are about sexual dimorphism –apparently driven by female mate choice– in Stegosaurus dinosaurs. Also, research just published about editing DNA in human zygotes has generated numerous editorials in science journals (we’ll hear more about it in the upcoming months). The Hubble Telescope celebrates its 25th anniversary. And a powerful video by Stated Clearly Animations on “What is The Evidence For Evolution” — GPC.
Sexual Dimorphism in the Plated Dinosaur Stegosaurus? Yes, why not. Study just published in PLoS ONE.
Author E. T. Saitta summarizes the research as follows: “Conclusive evidence for sexual dimorphism in non-avian dinosaurs has been elusive… [D]imorphism in the shape of the dermal plates of Stegosaurus mjosi (Upper Jurassic, western USA)… is most likely a sexually dimorphic feature. One morph possessed wide, oval plates 45% larger in surface area than the tall, narrow plates of the other morph. Intermediate morphologies are lacking as… analysis supports marked size- and shape-based dimorphism… Taphonomy of a new quarry in Montana (JRDI 5ES Quarry) shows that at least five individuals were buried in a single horizon and were not brought together by water or scavenger transportation. This new site demonstrates co-existence, and possibly suggests sociality, between two morphs that only show dimorphism in their plates. Without evidence for niche partitioning, it is unlikely that the two morphs represent different species. Histology of the new specimens in combination with studies on previous specimens indicates that both morphs occur in fully-grown individuals. Therefore, the dimorphism is not a result of ontogenetic change. Furthermore, the two morphs of plates do not simply come from different positions on the back of a single individual. Plates from all positions on the body can be classified as one of the two morphs, and previously discovered, isolated specimens possess only one morph of plates. Based on the seemingly display-oriented morphology of plates, female mate choice was likely the driving evolutionary mechanism rather than male-male competition. Dinosaur ornamentation possibly served similar functions to the ornamentation of modern species…” For complete study go to PLoS ONE.
Gene Editing in Human Zygotes? Again, yes, and we’ll hear more debate about this type of research in the social media and science editorials.
Editing Human DNA at the Zygote Level. Image from Shutterstock (Nature).
Liang et al. (total sixteen authors) just published an article in the journal Protein & Cell about DNA-engineering in human zygotes, specifically of genes involved in blood disorders. The authors summarized the research as follows: “Genome editing tools such as the clustered regularly interspaced short palindromic repeat (CRISPR)-associated system (Cas) have been widely used to modify genes in model systems including animal zygotes and human cells, and hold tremendous promise for both basic research and clinical applications. To date, a serious knowledge gap remains in our understanding of DNA repair mechanisms in human early embryos, and in the efficiency and potential off-target effects of using technologies such as CRISPR/Cas9 in human pre-implantation embryos. [Liang et al.] used tripronuclear (3PN) zygotes to further investigate CRISPR/Cas9-mediated gene editing in human cells. [The authors] found that CRISPR/Cas9 could effectively cleave the endogenous β-globin gene (HBB). However, the efficiency of homologous recombination directed repair (HDR) of HBB was low and the edited embryos were mosaic. Off-target cleavage was also apparent in these 3PN zygotes as revealed by the T7E1 assay and whole-exome sequencing. Furthermore, the endogenous delta-globin gene (HBD), which is homologous to HBB, competed with exogenous donor oligos to act as the repair template, leading to untoward mutations. [The] data also indicated that repair of the HBB locus in these embryos occurred preferentially through the non-crossover HDR pathway. Taken together, [the study] highlights the pressing need to further improve the fidelity and specificity of the CRISPR/Cas9 platform, a prerequisite for any clinical applications of CRSIPR/Cas9-mediated editing.” For complete study go to Protein & Cell; for criticisms go to Nature (Chinese Scientists Genetically Modify Human Embryos).
According to Nature magazine, Liang et al. “attempted to modify the gene responsible for β-thalassaemia, a potentially fatal blood disorder, using a gene-editing technique known as CRISPR/Cas9… [The researchers] injected 86 embryos and then waited 48 hours, enough time for the CRISPR/Cas9 system and the molecules that replace the missing DNA to act — and for the embryos to grow to about eight cells each. Of the 71 embryos that survived, 54 were genetically tested. This revealed that just 28 were successfully spliced, and that only a fraction of those contained the replacement genetic material… [The researchers] also found a surprising number of ‘off-target’ mutations assumed to be introduced by the CRISPR/Cas9 complex acting on other parts of the genome. This effect is one of the main safety concerns surrounding germline gene editing because these unintended mutations could be harmful. The rates of such mutations were much higher than those observed in gene-editing studies of mouse embryos or human adult cells.” For more discussion go to Nature.
25 years of The Hubble Telescope. One of NASA’s amazing scientific achievements… An acute eye on the cosmos!
After twenty five years in operation, and five servicing missions (1993, 1997, 1999, 2002, 2009), NASA’s Hubble Telescope continues to send images of impressive quality. Here is NASA’s overview of The Hubble Telescope (for detailed information go to NASA’s Hubble):
Hubble has made more than 1.2 million observations since its mission began in 1990.
Astronomers using Hubble data have published more than 12,800 scientific papers, making it one of the most productive scientific instruments ever built.
Hubble does not travel to stars, planets or galaxies. It takes pictures of them as it whirls around Earth at about 17,000 mph.
Hubble has traveled more than 3 billion miles along a circular low Earth orbit currently about 340 miles in altitude.
Hubble has no thrusters. To change pointing angles, it uses Newton’s third law by spinning its wheels in the opposite direction. It turns at about the speed of a minute hand on a clock, taking 15 minutes to turn 90 degrees.
Hubble has the pointing accuracy of .007 arc seconds, which is like being able to shine a laser beam on a dime 200 miles away.
Outside the haze of our atmosphere, Hubble can see astronomical objects with an angular size of 0.05 arc seconds, which is like seeing a pair of fireflies in Tokyo from your home in Maryland.
Hubble has peered back into the very distant past, to locations more than 13.4 billion light years from Earth.
The Hubble archive contains more than 100 Terabytes, and Hubble science data processing generates about 10 Terabytes of new archive data per year.
Hubble weighed about 24,000 pounds at launch and currently weighs about 27,000 pounds following the final servicing mission in 2009 – on the order of two full-grown African elephants.
Today’s EvoLiteracy News are sushi-, ultra-small nano-lanterns-, and bird-malaria related. The “Wasabi Receptor” protein has been 3D-characterized (watch video); the technology offers insights for possible drug-design to manage pain. “Nano-lanterns” genetically engineered to illuminate inside cells. Plus, recent studies of bird blood parasites, including avian malaria, suggest a likely center of speciation (high diversity) and endemism in Malawi. And a treat: watch a cool animation by TED Ed about ‘How we think complex cells evolved’ via endosymbiosis — GPC.
“Wasabi Receptor” research featured in journal Nature. Yes, it is about the inseparable and irritant sushi companion!
Wasabi and ‘wasabi receptor’ 3D images. Click on image for links to UCSF press release.
The article, authored by Paulsen and four other collaborators, most currently affiliated with the University of California San Francisco, is titled StructureoftheTRPA1 Ion Channel Suggests Regulatory Mechanisms. The UCSF press release highlights the research as a “First Look at ‘Wasabi Receptor’ Brings Insights for Pain Drug Development… Protein’s Structure Will Guide Hunt for New Treatments of Inflammation-Induced Pain…”
“TRPA1, the newly visualized protein resides in the cellular membrane of sensory nerve cells. It detects chemical agents originating outside our bodies —pungent irritants found in substances ranging from wasabi to tear gas— but is also triggered by pain-inducing signals originating within, especially those that arise in response to tissue damage and inflammation.”
The authors formally summarize the science as follows: “The TRPA1 ion channel (also known as the wasabi receptor) is a detector of noxious chemical agents encountered in our environment or produced endogenously during tissue injury or drug metabolism. These include a broad class of electrophiles that activate the channel through covalent protein modification. TRPA1 antagonists hold potential for treating neurogenic inflammatory conditions provoked or exacerbated by irritant exposure. Despite compelling reasons to understand TRPA1 function, structural mechanisms underlying channel regulation remain obscure. Here we [Paulsen et al.] use single-particle electron cryo-microscopy to determine the structure of full-length human TRPA1 to 4A resolution in the presence of pharmacophores, including a potent antagonist. Several unexpected features are revealed, including an extensive coiled-coil assembly domain stabilized by polyphosphate co-factors and a highly integrated nexus that converges on an unpredicted transient receptor potential ( TRP)-like allosteric domain. These findings provide new insights into the mechanisms of TRPA1 regulation, and establish a blueprint for structure-based design of analgesic and anti-inflammatory agents.” For original scientific paper go to Nature.
Below, watch 1:10-min ‘Wasabi Receptor’ video released by UCSF:
Time-lapse dual-color luminescent imaging of cyan and orange colored cells. Click on image to watch video.
Takai et al. (total nine coauthors) titled their article Expanded Palette of Nano-lanterns for Real-time Multicolor Luminescence Imaging. The authors highlight the significance of their findings as follows: “The application of luminescence imaging has been limited mainly by the two drawbacks of luciferases: low brightness and poor color variants. [Takai et al.] report the development of cyan and orange luminescent proteins approximately 20 times brighter than the wild-type Renilla luciferase. The color change and enhancement of brightness were both achieved by exploring bioluminescence resonance energy transfer (BRET) from enhanced Renilla luciferase to a fluorescent protein, a technology that [the researchers] previously reported for the development of the bright yellowish-green luminescent protein Nano-lantern. These cyan and orange Nano-lanterns along with the original yellow Nano-lantern enable monitoring of multiple cellular events, including dynamics of subcellular structures, gene expressions, and functional status, such as intracellular Ca2+ change.” For complete study and video images go to PNAS.
The summarized article’s abstract reads: “…The brightness of these cyan and orange Nano-lanterns… allowed [Takai et al.] to perform multicolor live imaging of intracellular submicron structures. The rapid dynamics of endosomes and peroxisomes were visualized at around 1-s temporal resolution, and the slow dynamics of focal adhesions were continuously imaged for longer than a few hours without photobleaching or photodamage. In addition, [the researchers] extended the application of these multicolor Nano-lanterns to simultaneous monitoring of multiple gene expression or Ca2+ dynamics in different cellular compartments in a single cell.” Read more in PNAS.
79% of Malawi’s birds infected with blood parasites. High parasite diversity and endemism suggest Malawi’s ecosystems might have been the center of avian malaria origins; PLoS ONE.
Lutz et al. (total eight coauthors) titled their article Parasite Prevalence Corresponds to Host Life History in a Diverse Assemblage of Afrotropical Birds and Haemosporidian Parasites. The authors tested the hypothesis that life history traits of Afrotropical birds predict rates of parasitism by haemosporidian parasites (including Plasmodium, Haemoproteus and Leucocytozoon). Lutz et al. included in their analyses “traits known to be associated with host-vector encounter rates (for example, nest type, nest placement and flocking behavior).” They “combined taxonomic sampling of host species from a wide variety of habitats and life histories in Northern Malawi with the application of PCR-based methods to detect rates of parasitism.” In addition, Lutz et al. documented an “unprecedented prevalence of Plasmodium, Haemoproteus and Leucocytozoon infections across a broad range of birds belonging to 16 orders, 50 families, 100 genera, and 152 species.”
Mosquito biting a bird’s eye, where skin is exposed. Avian blood cell infested with Haemoproteus (center of image).
“Birds with closed cup nests experienced increased rates of Plasmodium infection and decreased rates of Haemoproteus infection, whereas cavity-nesting birds experienced increased rates of Leucocytozoon infection” But, perhaps most significantly, the authors found that “Haemosporidian prevalence in birds from… Malawi [was] higher than… other tropical regions… The results suggest that the Afrotropics is an area of high… endemicity and diversity… Southeastern Africa is… an important region in which to investigate… host-parasite associations, speciation, and the evolution of malaria parasites and other closely related haemosporidians.”
Lutz et al. formally summarize the research as follows: “Avian host life history traits have been hypothesized to predict rates of infection by haemosporidian parasites. Using molecular techniques, we tested this hypothesis for parasites from three haemosporidian genera (Plasmodium, Haemoproteus, and Leucocytozoon) collected from a diverse sampling of birds in northern Malawi. We found that host life history traits were significantly associated with parasitism rates by all three parasite genera. Nest type and nest location predicted infection probability for all three parasite genera, whereas flocking behavior is an important predictor of Plasmodium and Haemoproteus infection and habitat is an important predictor of Leucocytozoon infection. Parasite prevalence was 79.1% across all individuals sampled, higher than that reported for comparable studies from any other region of the world. Parasite diversity was also exceptionally high, with 248 parasite cytochrome b lineages identified from 152 host species. A large proportion of Plasmodium, Haemoproteus, and Leucocytozoon parasite DNA sequences identified in this study represent new, previously undocumented lineages (n = 201; 81% of total identified) based on BLAST queries against the avian malaria database, MalAvi.” Read complete open access study in PLoS ONE.
Video: How we think complex cells evolved – Adam Jacobson TED Ed Lessons – Imagine you swallowed a small bird and suddenly gained the ability to fly … or you ate a cobra and were able to spit poisonous venom! Well, throughout the history of life (and specifically during the evolution of complex eukaryotic cells) things like this happened all the time. Adam Jacobson explains endosymbiosis, a type of symbiosis in which one symbiotic organism lives inside another.
Today’s EvoLiteracy picks are quite fun: First, a note about Neil deGrasse Tyson’s participation at this year’s UMass Amherst Undergraduate Commencement. Neill will be speaking to 5.5k undergrads on May 8th. Second, three new species descriptions –just published yesterday, April 6– of lizards in the genus Enyalioides, by colleagues at the Museum of Zoology QCAZ at the Pontifical Catholic University of Ecuador (yes, my undergraduate “Alma Mater”). And, third, a cool animation by TEDEd about how geckos defy gravity! Enjoy – GPC.
The UMass Amherst press release states: “Dr. Tyson’s professional research interests include star formation, exploding stars, dwarf galaxies and the structure of the Milky Way. He most recently became executive editor and on-camera host for Cosmos: A Spacetime Odyssey, the 21st century reboot of Carl Sagan’s landmark television series. The show ran 13 episodes and appeared in 181 countries and in 45 languages –on the National Geographic Channels. Cosmos has been nominated for 13 Emmy Awards, including Outstanding Documentary.” Read detailed story at UMass Amherst News & Media Relations, and The Boston Globe.
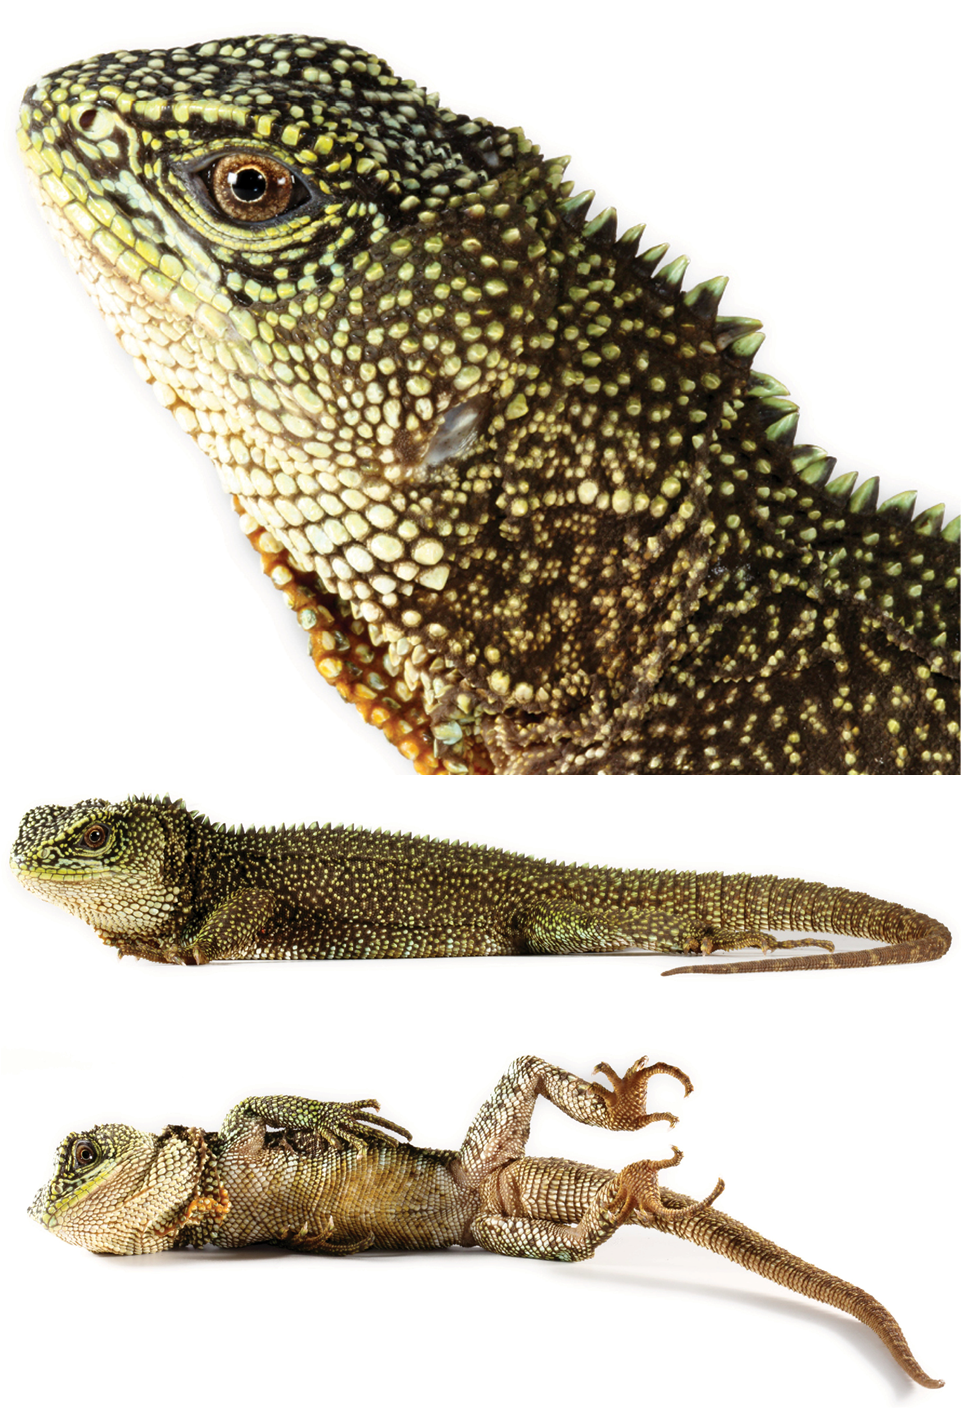
More from Ecuador and Peru: Colorful New ‘Dwarf Dragons’ Found in South America.
From Nat Geo: “Wood lizards are among the largest and most colorful lizards in South American forests, making their discovery even more notable. It took a decade for scientists to identify the reptiels, which are commonly called wood lizards. They are the Alto Tambo wood lizard (Enyalioides altotambo), rough-scaled wood lizard (E. anisolepis), and Rothschild’s wood lizard (E. sophiarothschildae). The discovery brings the total number of wood lizard species to 15. That’s nearly twice the number of species known in 2006—giving this group of South American reptiles one of the fastest discovery rates of the past decade.”
The study, authored by Omar Torres-Carvajal, Pablo J. Venegas and Kevin de Queiroz was published yesterday, April 6, 2015, in ZooKeys. The authors summarize the research as follows: “The discovery of three new species of Enyalioides from the tropical Andes in Ecuador and northern Peru is reported. Enyalioidesaltotambosp. n. [new species] occurs in northwestern Ecuador and differs from other species of Enyalioides in having dorsal scales that are both smooth and homogeneous in size, a brown iris, and in lacking enlarged, circular and keeled scales on the flanks. Enyalioidesanisolepissp. n. [new species] occurs on the Amazonian slopes of the Andes in southern Ecuador and northern Peru and can be distinguished from other species of Enyalioides by its scattered, projecting large scales on the dorsum, flanks, and hind limbs, as well as a well-developed vertebral crest, with the vertebrals on the neck at least three times higher than those between the hind limbs. Enyalioidessophiarothschildaesp. n. [new species] is from the Amazonian slopes of the Cordillera Central in northeastern Peru; it differs from other species of Enyalioides in having caudal scales that are relatively homogeneous in size on each caudal segment, a white gular region with a black medial patch and several turquoise scales in males, as well as immaculate white labials and chin. A molecular phylogenetic tree of 18 species of hoplocercines is presented, including the three species described in this paper and E.cofanorum, as well as an updated identification key for species of Hoplocercinae.” For complete study and images go to ZooKeys, and for popular media article go to NatGeo.
Above: Holotype of Enyalioidesaltotambo. Photo Luis A. Coloma.
Above: Paratype of Enyalioidesaltotambo. Photo by Luis A. Coloma.
Above: Holotype of Enyalioidesanisolepis. Photo by Omar Torres-Carvajal.
Above: Holotype of Enyalioidessophiarothschildae. Photo by Pablo J. Venegas
How do geckos defy gravity? Watch a cute video, with some serious information by TEDEd Lessons Worth Sharing.
From TEDEd: “Geckos aren’t covered in adhesives or hooks or suction cups, and yet they can effortlessly scale vertical walls and hang from ceilings. What’s going on? Eleanor Nelsen explains how geckos’ feet allow them to defy gravity.” Watch the video produced by TEDEd Lessons Worth Sharing.
In preparation for “the sequel”… Here are some mini-reviews of Evolution Stands Faith Up: Reflections on Evolution’s Wars. I thank Greg M. Scott, Herb Silverman, Jeff Podos, Jan A. Pechenik, George A. Lozano and Stan Braude for their generous statements about the book – GPC. More in-depth reviews are posted at EvoLiteracy Book Reviews.
“This is an inspiring, readable collection of essays of reflective value to everyone. Paz-y-Miño-C points to the vain attempt by many to try and accommodate scientific rationalism with supernatural beliefs. They are simply incompatible. The author has a marvelously eloquent style of writing, full of inspiring metaphors and lateral observations that reinforce connections to the foundations of scientific inquiry and to biological evolution in particular. These thoughtful essays… are inspiring… [and] help clear the fog in our communities and arm our neighbors [with arguments] against theistic anti-science, medical quackery and other irrational nonsense.” – Greg M. Stott, PhD, Geoscientist with the Ontario Geological Survey, Canada.
“Paz-y-Miño-C doesn’t ask the reader to ‘believe’ in evolution. He provides overwhelming evidence, clearly written, that shows how scientific inquiry leads to important and practical results, while superstition and faith lead nowhere. Although we may not be able to reason someone out of what they were never reasoned into, the author presents a roadmap for those whose minds are open to discover the wonders and beauty of science.” – Herb Silverman, PhD, author of Candidate Without a Prayer: An Autobiography of a Jewish Atheist in the Bible Belt.
“The sweet spot of this collection of essays is the interface of science, history and literacy. Paz-y-Miño-C is, in essence, a champion of rationalism and a passionate defender of literacy standards. His essays deftly weave hard survey data and memorable turns of phrase with evocative imagery… While the essays in this collection are vast in coverage —from climate change to energy policy, stem cell research, vaccinations and, especially, evolution— a clear underlying theme emerges: [the author’s] goal is no less than to counter, through the lens of history and the majesty of rationalism, social forces that sanction ignorance, celebrate denial and… continue to diminish our global status in the fields of science and technology.” Jeff Podos, PhD, Professor of Biology, University of Massachusetts Amherst, USA.
“Paz-y-Miño-C is a firm believer in evolutionary processes. He would like to see decisions made on the basis of facts, not unsupported opinion. He abhors and fears irrational thinking, especially ‘the views of those who see evil in truth and menace in the realities discovered by science.’ He marvels at the intricacy and diversity of life, and how it came about through natural selection… and is clearly frustrated by the unwillingness of so many to see the beauty and majesty in this view of the world and all that it explains.” – Jan A. Pechenik, PhD, Professor of Biology, Tufts University, USA, author of The Readable Darwin: The Origin of Species, as Edited for Modern Readers.
“Many scientists would probably agree that the struggle against creationism as an alternative to science is a war that must be waged. However, we all know it is a difficult fight… After all, how does one produce a coherent, logical and intelligent argument against an opponent whose very aim is to create confusion, to deny reality, and to promote ignorance? Few among us have the audacity. With this book, Paz-y-Miño-C establishes himself as a clear, lucid, and refreshingly candid fighter of creationism and defender of evolution.” – George A. Lozano, PhD, Estonian Centre of Evolutionary Ecology, Estonia.
“Too many of our colleagues work so hard to appear open minded that their brains seem to have fallen out. When they teach our students that they can pick and choose when to be logical, critical thinkers, they are modeling the type of reasoning that leads to the politics of convenience and its bridesmaids: racism, sexism, and the whole host of xenophobias. Paz-y-Miño-C is a prolific essayist, he does not pull any punches, but when he cuts to the core of an argument, he does it with the flare of a true artist.” – Stan Braude, PhD, Professor of Practice in Biology, Washington University in St. Louis, USA.


You must be logged in to post a comment.